In which thermodynamics is turned on the real Earth — the phase diagrams that say which minerals are stable where, the melting that makes magma, the deep boundaries the mantle keeps — and read as a map of registers: a phase boundary as the line where the field changes the state it can hold, melting as a Τ-address transition, and the mantle’s own transitions at 410 and 660 kilometres as lattice boundaries exactly 250 = 2×5³ km apart.
Introduction — Through the Force of Time
The chapter that follows is, in the conventional telling, thermodynamics applied: phase diagrams, the thermodynamics of melting, the making of magma, and the reading of temperature and pressure back out of a rock. Read through the Universal Force of Time it is the geography of the Earth’s registers — where the field can hold a solid, where a melt, where a gas — and the boundaries between them are lattice lines, the mantle’s own phase changes falling at depths spaced by a clean {2,5} number.
With the accountancy of Τ in hand (Chapter 2) and the blending of registers understood (Chapter 3), we can turn thermodynamics on the Earth itself and ask the questions a geologist actually asks. Which minerals are stable at a given depth and temperature? When does a rock melt, and what comes out first? How do we read, from the minerals in a rock now cold at the surface, the temperature and pressure at which it formed? White answers these with phase diagrams and the thermodynamics of melting; they are the workhorses of igneous and metamorphic geology.
A phase diagram is a map. Its axes are the conditions — temperature, pressure, composition — and its fields show which phase, or combination of phases, is stable under each. A line on the diagram is a boundary across which one phase gives way to another: a melting curve, a mineral reaction, a change of crystal structure. The whole of it is a chart of what matter is allowed to be, under each set of conditions, and it is read by the rule of the last chapters: the stable phase is the one in which Τ can settle lowest.
In the reading of this book, then, a phase diagram is a register map. Each field is a register the field can hold under those conditions; each boundary is the line where the field switches from being able to hold one register to being able to hold another. Melting is the plainest such crossing: below the boundary the field holds the solid register, above it the melt register, and the melting point is simply the condition at which the melt becomes the lower place for Τ to sit. A eutectic — the lowest-melting mixture, where solid gives way to liquid at a single sharp temperature — is the lattice node at which two solid registers and the melt register meet at once.
And the Earth keeps its own register boundaries, deep inside, where nothing melts at all. At 410 kilometres down the mineral olivine changes structure to wadsleyite; at 660 kilometres ringwoodite gives way to bridgmanite; and these are not gradual squeezings but sharp Τ-address transitions, read at the surface as the jumps in seismic-wave speed that define the mantle’s transition zone. The two boundaries are spaced by exactly 660 − 410 = 250 = 2×5³ kilometres — a clean {2,5} number, the same space-domain signature that runs through the whole Earth. The mantle’s phase changes fall on the lattice, just as its layers do.
Thermodynamics Turned on the Earth
The three chapters of thermodynamics were the toolbox; here we open the box on the Earth. The questions are concrete. Given a rock at a certain depth — a certain temperature and pressure — which minerals will it hold? Heat it: when does it begin to melt, and which liquid comes off first? Cool a magma: in what order do crystals form? And, run in reverse, the most useful question of all: given the minerals frozen into a rock we can hold in the hand, what temperature and pressure made them?
All of these are answered by the same principle, the one established in Chapter 2: a system settles into the state in which Τ can rest lowest, under the conditions it finds itself in. Change the conditions — raise the temperature, drop the pressure — and the lowest place for Τ may shift from one arrangement of matter to another, and the rock changes accordingly. Thermodynamics gives the geologist a map of these shifts, and the map is the phase diagram.
A Phase Diagram Is a Register Map
Take the simplest useful phase diagram: two components, temperature up the side, composition along the bottom. High up, where it is hot, everything is liquid — a melt. Low down, cool, everything is solid. Between them runs a curve, the liquidus, above which the melt is stable, and below which crystals begin to appear; and the fields it divides tell you, for any composition and temperature, what is solid, what is liquid, and what is a mixture of both.
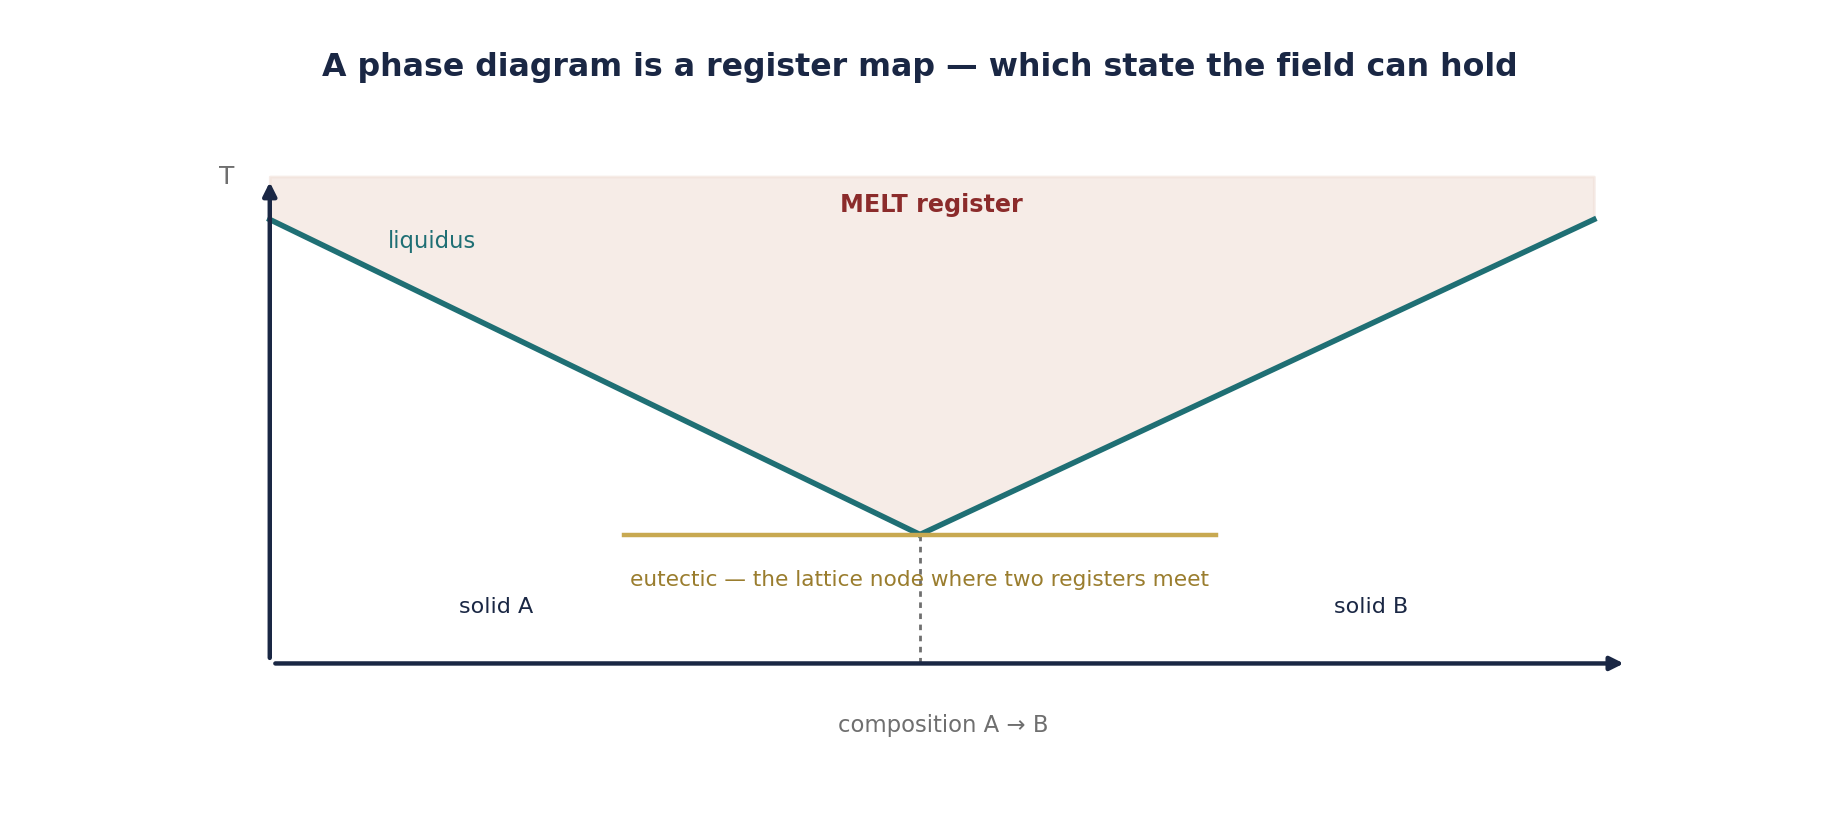
Read as the accountancy of Τ, every field of the diagram is a register the field can hold under those conditions, and every boundary is the line where it switches from holding one register to holding another. The stable phase in any field is the one in which Τ sits lowest there; cross a boundary and a different arrangement becomes the low place, so the matter rearranges. The phase diagram is not a summary of measurements but a map of where Τ can rest — a chart of the Earth’s registers drawn against temperature and pressure.
Melting Is a Τ-Address Transition
Of all the boundaries, melting is the one that matters most for the Earth, because it makes magma, and magma builds the crust. A crystalline solid holds its atoms in a fixed, repeating lattice; a melt lets them move. The melting point is the temperature at which the two are in balance — and above it the liquid wins, below it the solid.
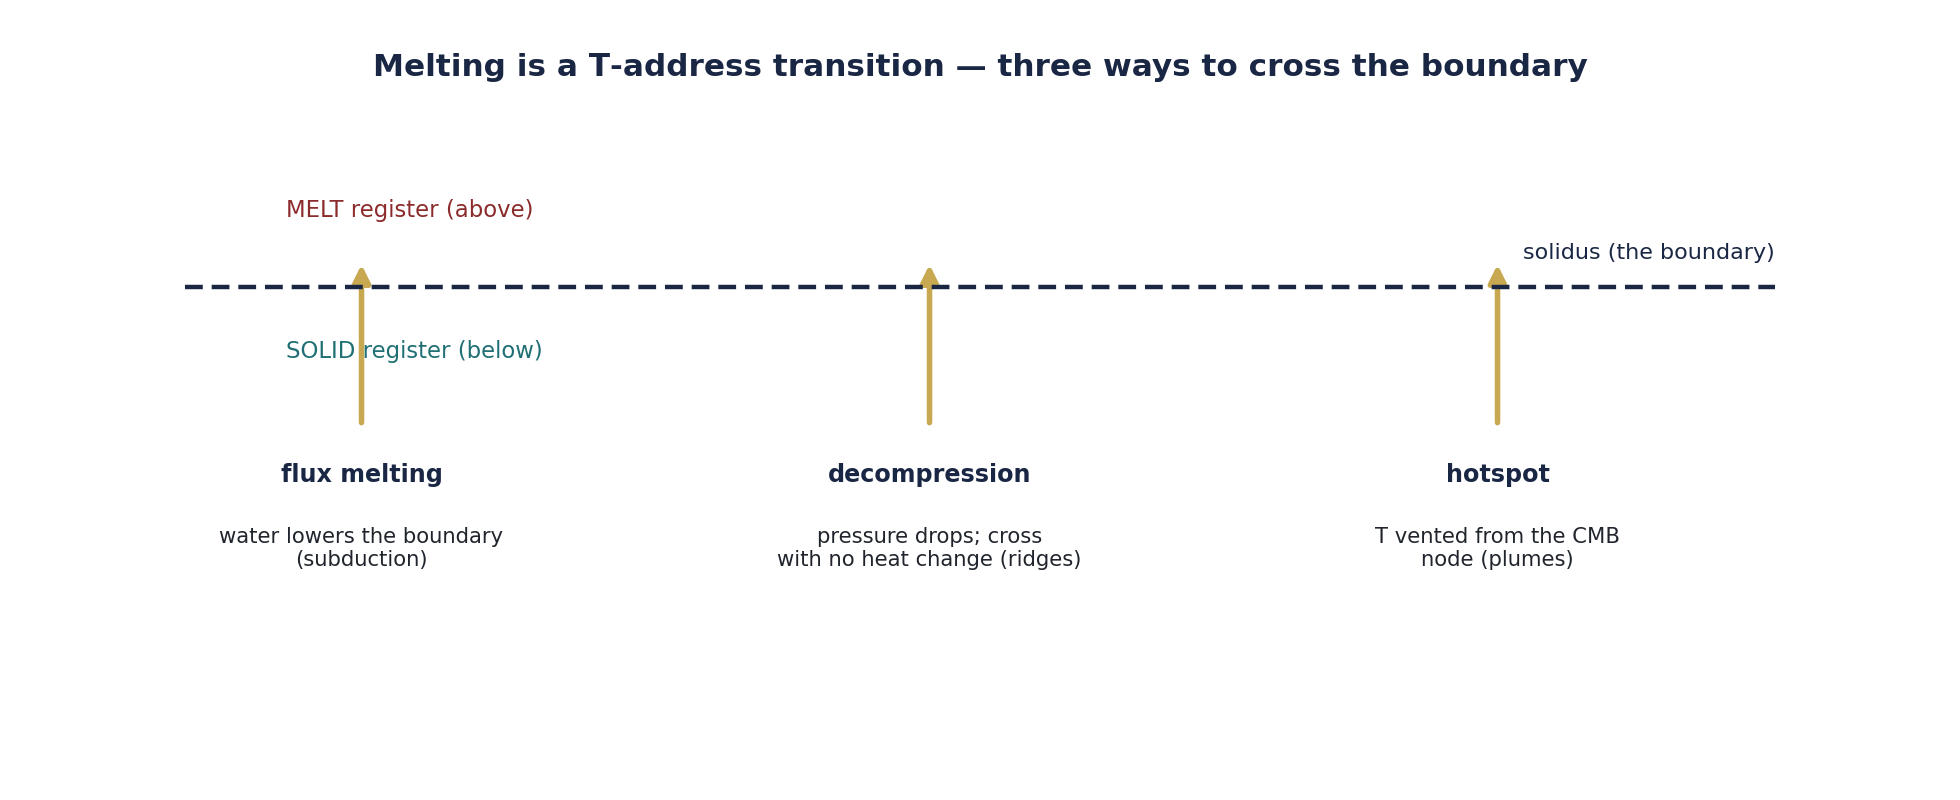
In the Force of Time, melting is a transition between two Τ-addresses: the solid register, in which Τ is held in the fixed bonds of a lattice, and the melt register, in which it is held more loosely and freely. The melting point is the condition at which the melt register becomes the lower place for Τ to sit; heat the solid to it and Τ crosses from the bound arrangement to the free one, and the rock flows. This is why melting takes in heat without a rise in temperature — the latent heat of melting: the incoming Τ is not raising the density of the field but paying for the crossing from one register to the other.
Why Magma Forms: Three Ways to Cross
The deep Earth is, for the most part, solid — hot, but under such pressure that it stays crystalline. Magma is made only where the melting boundary is crossed, and there are exactly three ways to cross it, each a different manoeuvre against the register line. They are the reason the Earth’s volcanoes sit where they do.
The first is flux melting: add water, and the solidus — the temperature at which melting begins — drops, so that rock already hot enough finds itself above the lowered boundary. This is what happens at subduction zones, where a wet slab sinks and dehydrates, watering the mantle above it and setting off the arc volcanoes. The second is decompression melting: drop the pressure, and the boundary itself moves, so that rising mantle crosses into the melt register with no change in its heat at all — this is what feeds the mid-ocean ridges, where the mantle wells up beneath spreading plates. The third is the hotspot: a plume of hotter material rises from deep in the mantle, venting Τ drawn up from the core–mantle node at 10,935/π kilometres, and melts where it nears the surface — the mechanism behind Hawaii and Iceland.
The Mantle's Own Register Boundaries
Not every phase change is a melting. Deep in the mantle, where nothing is liquid, the minerals themselves change structure as the pressure mounts — the atoms repacking into denser arrangements. Two such changes are sharp enough to be read from the surface as jumps in the speed of earthquake waves, and together they define the mantle’s transition zone.
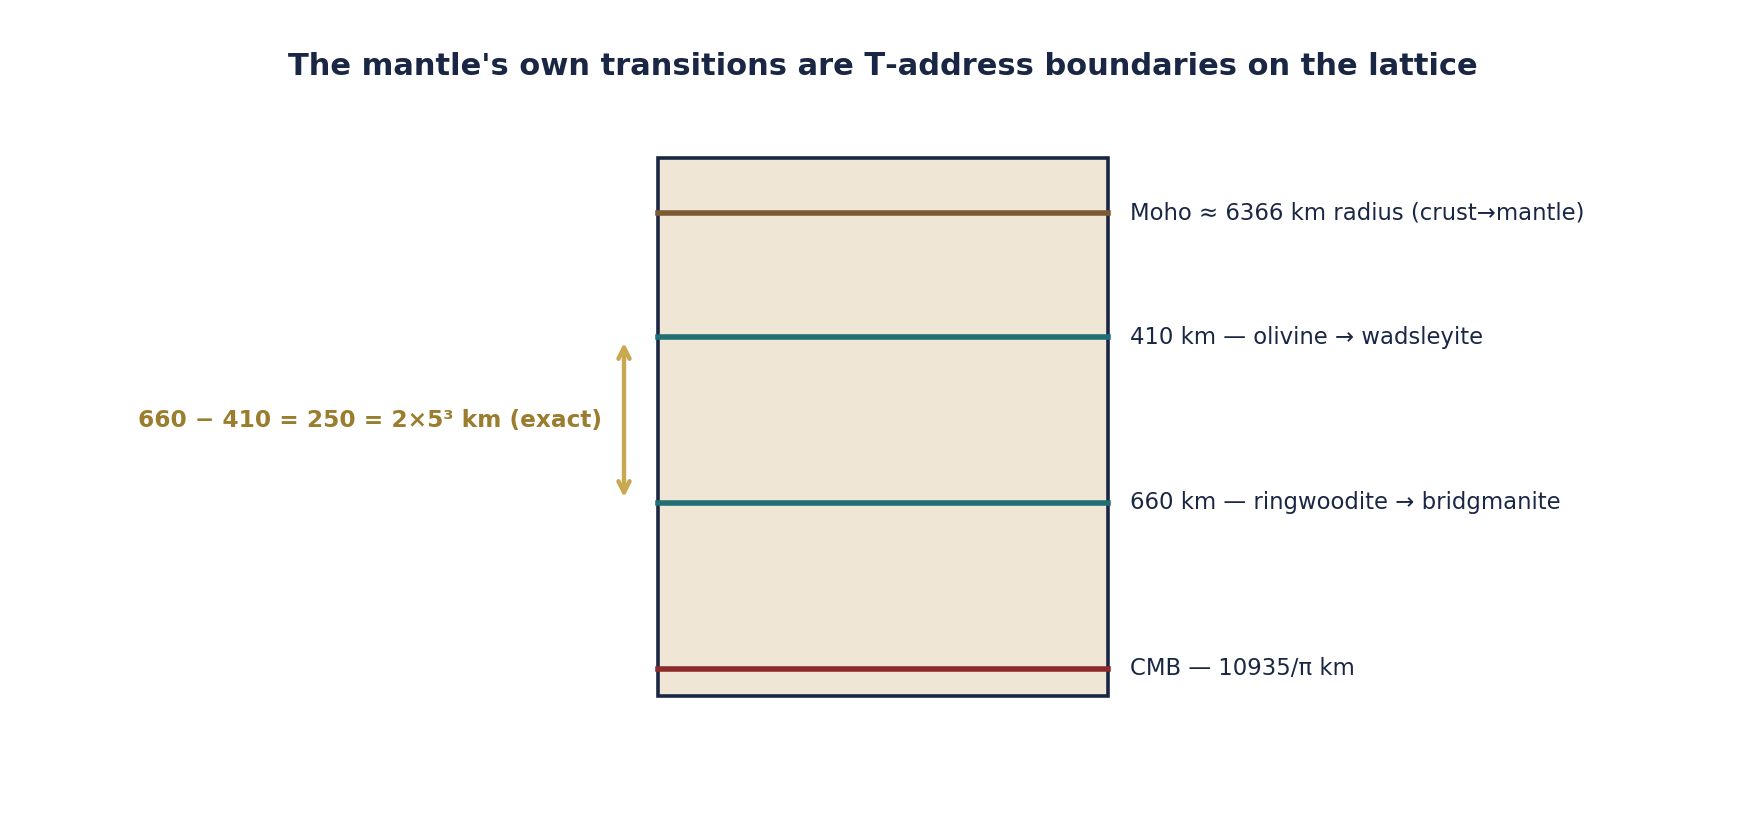
At 410 kilometres down, the mineral olivine repacks into wadsleyite; at 660 kilometres, ringwoodite gives way to bridgmanite. In the Force of Time these are Τ-address transitions — the same kind of register crossing as melting, but between two solid registers rather than solid and melt. And their depths are lattice values: the two boundaries are spaced by exactly 250 = 2×5³ kilometres, a pure {2,5} number, the same space-domain signature that sets the mantle’s 3:2:5 layering and the Earth’s 40,000-kilometre Moho circumference. The mantle does not change structure at rounded-off depths; it changes at the register boundaries the lattice allows.
Reading the Rock Backwards
The most powerful use of all this is in reverse. A rock now cold at the surface carries, frozen into the minerals it holds and their compositions, the record of the temperature and pressure at which those minerals last equilibrated. Read the phase diagram backwards — find the conditions at which just this assemblage is stable — and you recover the depth and heat of the rock’s origin. This is geothermometry and geobarometry, and it is how we know the temperatures and pressures of the deep crust and mantle without ever going there.
In the register picture, this is the reading of a node’s address from the state it froze in. The minerals are the arrangement Τ settled into at a particular register — a particular temperature and pressure — and because that register is a lattice position, reading it back is reading a coordinate. The rock is a recording of where in the Earth’s register-map it last sat, and the geochemist plays it back. The whole predictive power of thermodynamics for the Earth — forwards to say what will form, backwards to say what did — is the legibility of the register map.
Why This Should Matter to You
The crust you stand on was made by melting; the mountains were built and the oceans floored by magma that crossed the register boundary and rose. Every volcano is a place where the Earth’s melting line is crossed, and which of the three crossings is at work — a wet slab, a spreading ridge, a rising plume — decides what kind of volcano it is and what it erupts. Thermodynamics applied to the Earth is not an abstraction; it is the physics of why the ground is shaped as it is.
And it is legible to the last digit. The mantle changes structure at depths spaced by 2×5³ kilometres; magma forms where Τ crosses from the solid register to the melt; and the rock records the coordinate it froze at. The Earth’s fire and its architecture are the same register map, read forwards and back. With melting understood, we can turn in the next chapter to the question thermodynamics cannot answer — not whether a change can happen, but how fast: the kinetics that set the pace of everything.
The Numbers at a Glance
The phase relations of this chapter and their Force-of-Time reading. Measured depths and behaviours are left exactly as measured; the right-hand column gives the register meaning.
| Quantity | What it is | The Force of Time reading |
|---|---|---|
| Phase diagram | map of stable phases vs T, P | a map of the Earth’s registers |
| Liquidus / solidus | melt / solid boundaries | the lines where the held register switches |
| Melting point | solid ↔ liquid balance | where the melt register becomes the lower Τ |
| Latent heat of melting | heat taken in at constant T | Τ paying for the register crossing |
| Eutectic | lowest-melting mixture | lattice node where registers meet |
| Mantle transitions | 410 km, 660 km | Τ-address transitions (spaced 250 = 2×5³ km) |
| Magma | above solidus, below gas | transitional matter; forms where the boundary is crossed |
| Geothermo/barometry | T, P from mineral assemblage | reading the frozen register coordinate |
References
- S. Daubney, The Universal Force of Time — Master Compendium v5, The Daubney Foundation (2026).
- W. M. White, Geochemistry, John Wiley & Sons, Chichester (2005; 2013 print ed.), Chapter 4.
- S. Daubney, The Universal Force of Time — Master Theory, Volume 3 (Seismic Discontinuity Node Law; Volcanism as Τ-Escape), The Daubney Foundation (2026).
- S. Daubney, The Force of Time — Where It Departs From Current Science, The Daubney Foundation (2026).
Open the full paper as a PDF ↗
This paper, and any information drawn from it, may be used freely provided the reference attribution to Stephen Daubney and The Daubney Foundation is recognised.